Dashboards on the data you already govern
Build dashboards from SQL queries on the catalog and share them with your team. If your company uses Power BI, open the reports and refresh the datasets from Dataspheres too.
- Dashboards
- Spark and Kyuubi
- Power BI
- Unity Catalog
What you can do
Dashboards from SQL
Each chart comes from a query on the catalog. Bars, lines, pie, radial and sparkline charts sit side by side on the same panel.
- Chart type chosen per query
- Refresh the charts whenever you want
- Same permissions as the tables they read
Shared with the team
Dashboards are part of the profiles, so each team sees the panels that matter to it.
- Access to dashboards granted by profile
- One source of truth for every area
- No exports passed around by email
Power BI, when you use it
Connect your Power BI workspaces and open the published reports inside Dataspheres.
- Upload and download reports
- Refresh datasets and see the refresh history
- Schedule dataset refreshes
Questions in plain language
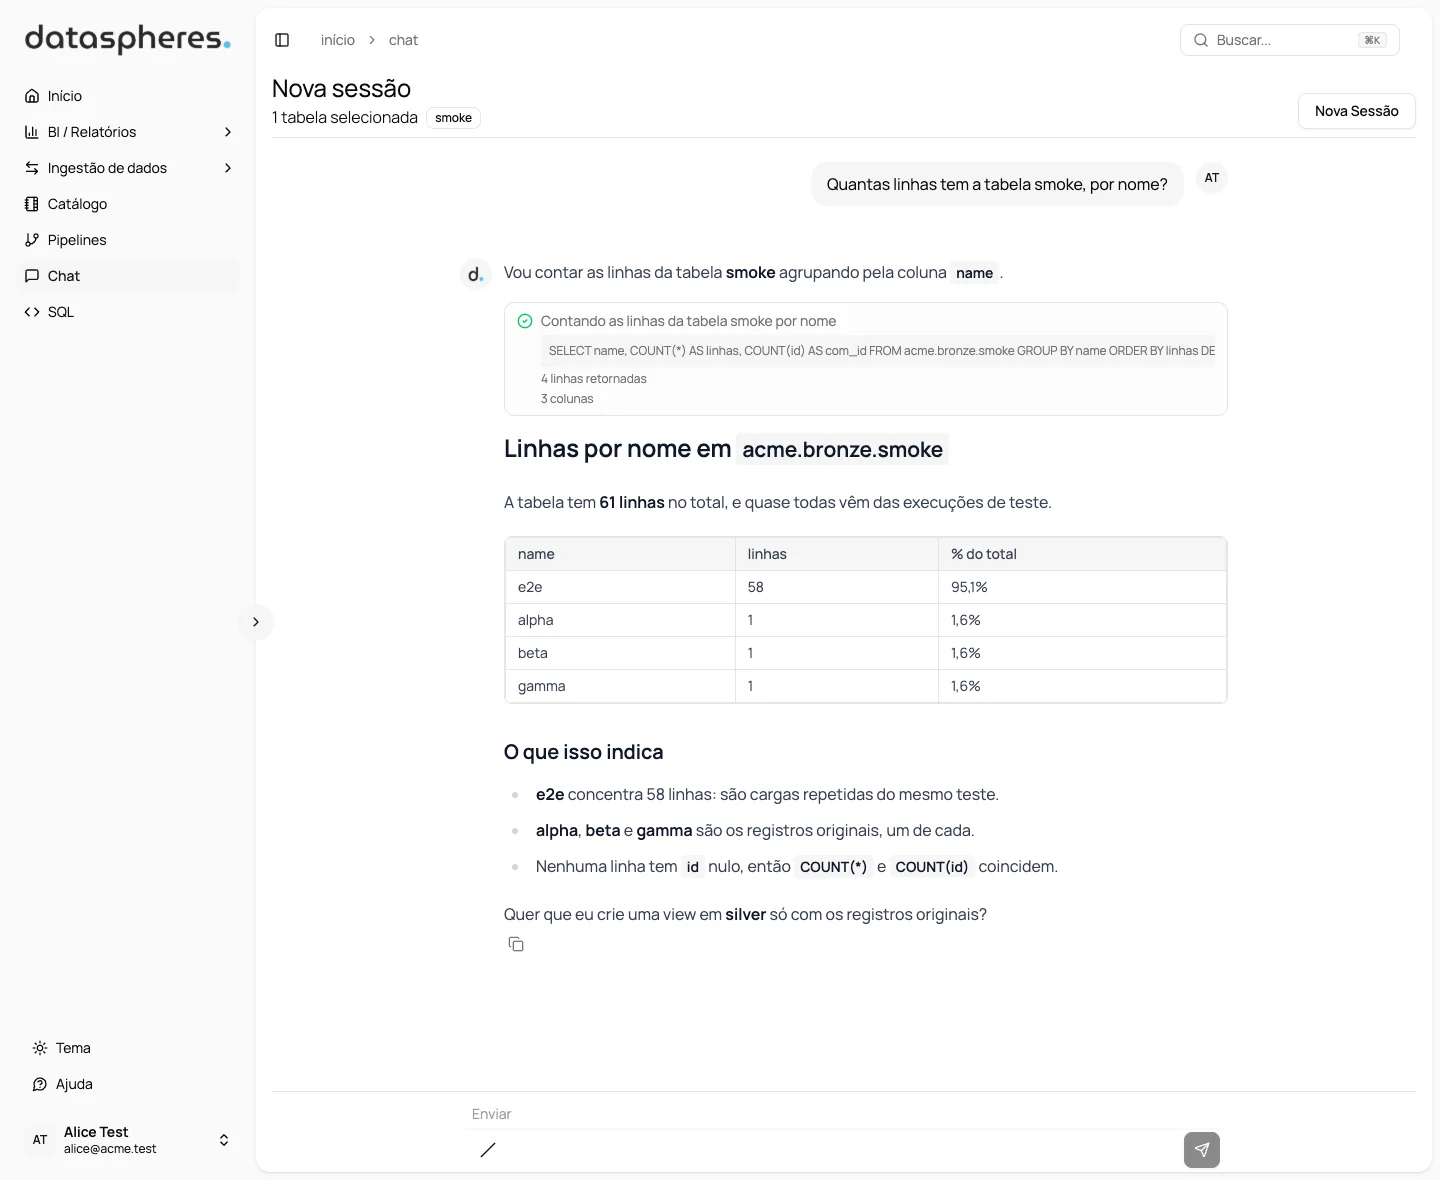
When a chart is not enough, ask the AI chat. It queries the catalog with your permissions and answers with your data.
- Answers show the queries they ran
- Tables and lists formatted for reading
- Conversation history saved per session
See Dataspheres with your own data
Book a demo and we will walk you through the whole path, from source to chat.